Your dashboard comes with widgets preconfigured to help you recognize where you are growing. These eight widgets make it easy to see changes in your new leads and closed sales over time and give you updates on your recent marketing efforts. These widgets report crucial metrics for your business and can help you identify where you can focus to continue to grow your business.
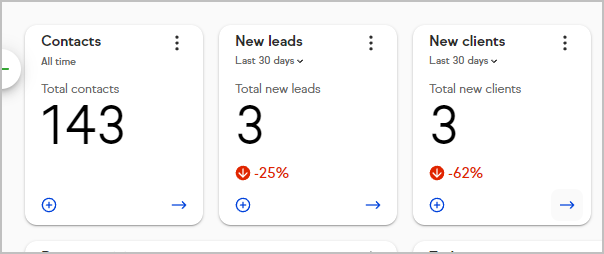
Contacts – The total number of contacts currently in Keap
New leads – The total number of contacts marked with the contact type of "Lead" within the given time frame chosen in the filter dropdown.
Note: This widget reports when contacts were marked with the contact type of "Lead", not when the contacts were added to Keap.
New clients – The total number of contacts marked with the contact type of "Client" within the given time frame chosen in the filter dropdown.
Note: This widget reports when contacts were marked with the contact type of "Client", not when the contacts were added to Keap.
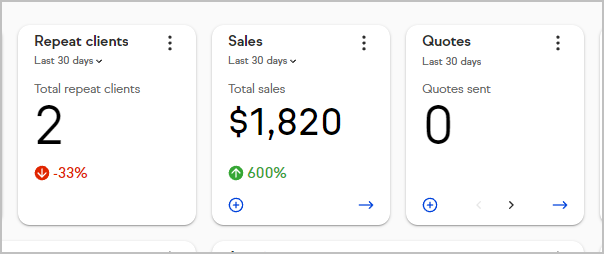
Repeat clients – Get visibility on your retention by seeing how many customers during a specified interval came back to make another purchase from you
Sales – View your total sales over a recent window of time and compare it to the sales from the previous interval
Quotes – Counts the total number of quotes you have sent in the past 30 days as well as how many have been accepted
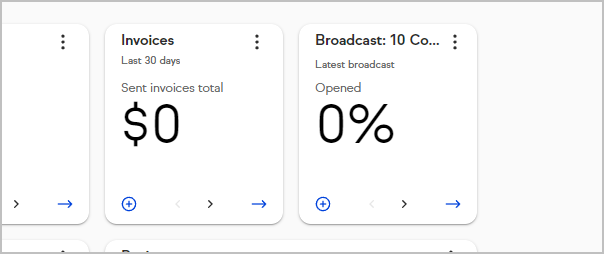
Invoices – Counts the total revenue for the invoices you have sent in the past 30 days as well as the amount of revenue received from paid invoices
Broadcasts – Reports the open rate and the click rate of your most recent email broadcast
FAQs
I added a lead, but the dashboard widget doesn't reflect that. Is it broken?
The widgets take about 2 minutes to update, so changes will not be reflected immediately.
Can I choose which date range the widget displays data for?
Yes, you can choose to display data from the last 7, 14, 30, or 60 days.
What's the percentage below the widget's total? How does it work?
This represents the percent change for the selected date range. For example, when your widget's date range is set to display data from the last 7 days, the percentage is comparing the number of contacts added in the last 7 days to the number of contacts added in the 7 days prior to that period (essentially comparing one week against another).
How does the repeat clients widget work?
The repeat clients widget tracks how many of your clients in a given window have purchased more than once. For example; if you have one or more fully paid invoices from a customer in the past and that customer also has at least one additional fully paid invoice in the interval you have set, they would be considered a repeat customer.
