View your sales data in graphical and itemized format with the All sales report in Keap. Just click on Reports in the side panel menu
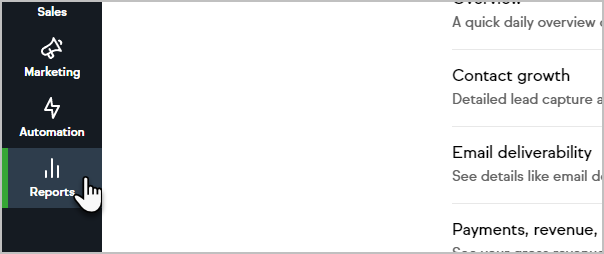

The All sales report will show you the following sales totals in the period you specify compared to the previous period:

- Total Sales
- Average order value
- Total number of sales
You can filter these numbers by:
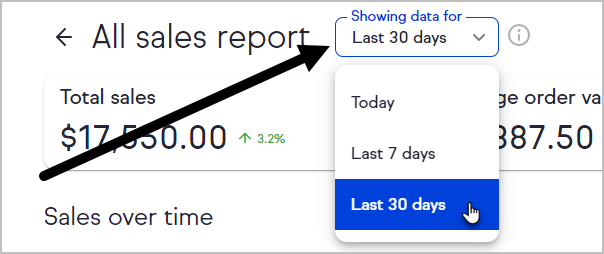
- Today
- Last 7 days
- Last 30 days
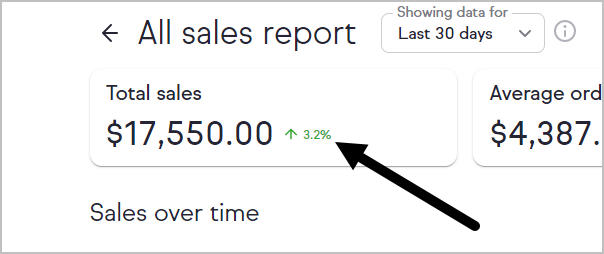
You will see the percent change from the previous period next to the dollar amount
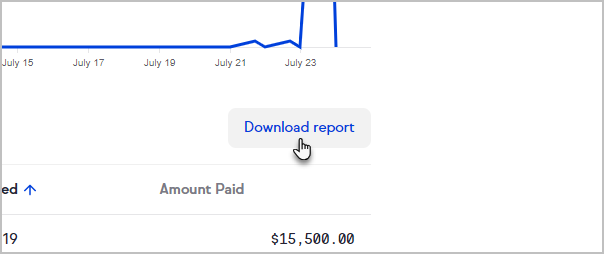
Below the graph, you will see an itemized list of orders.
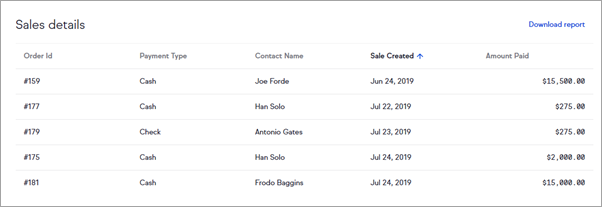
Click the Download report button to download the orders to a CSV file.
Keap Academy
 For more on this topic, check out this training from Keap Academy. Learn at your own-pace as experts walkthrough the set up and application of these features with context and strategic insight.